
Guides for using Nolimit Ads Manager.
Step-by-step articles for every module — you'll be running a workspace within minutes of reading.
Get started with Nolimit Ads Manager
Step-by-step: create your account, set up a workspace, invite teammates and install the Nolimit Connection extension to start operating.
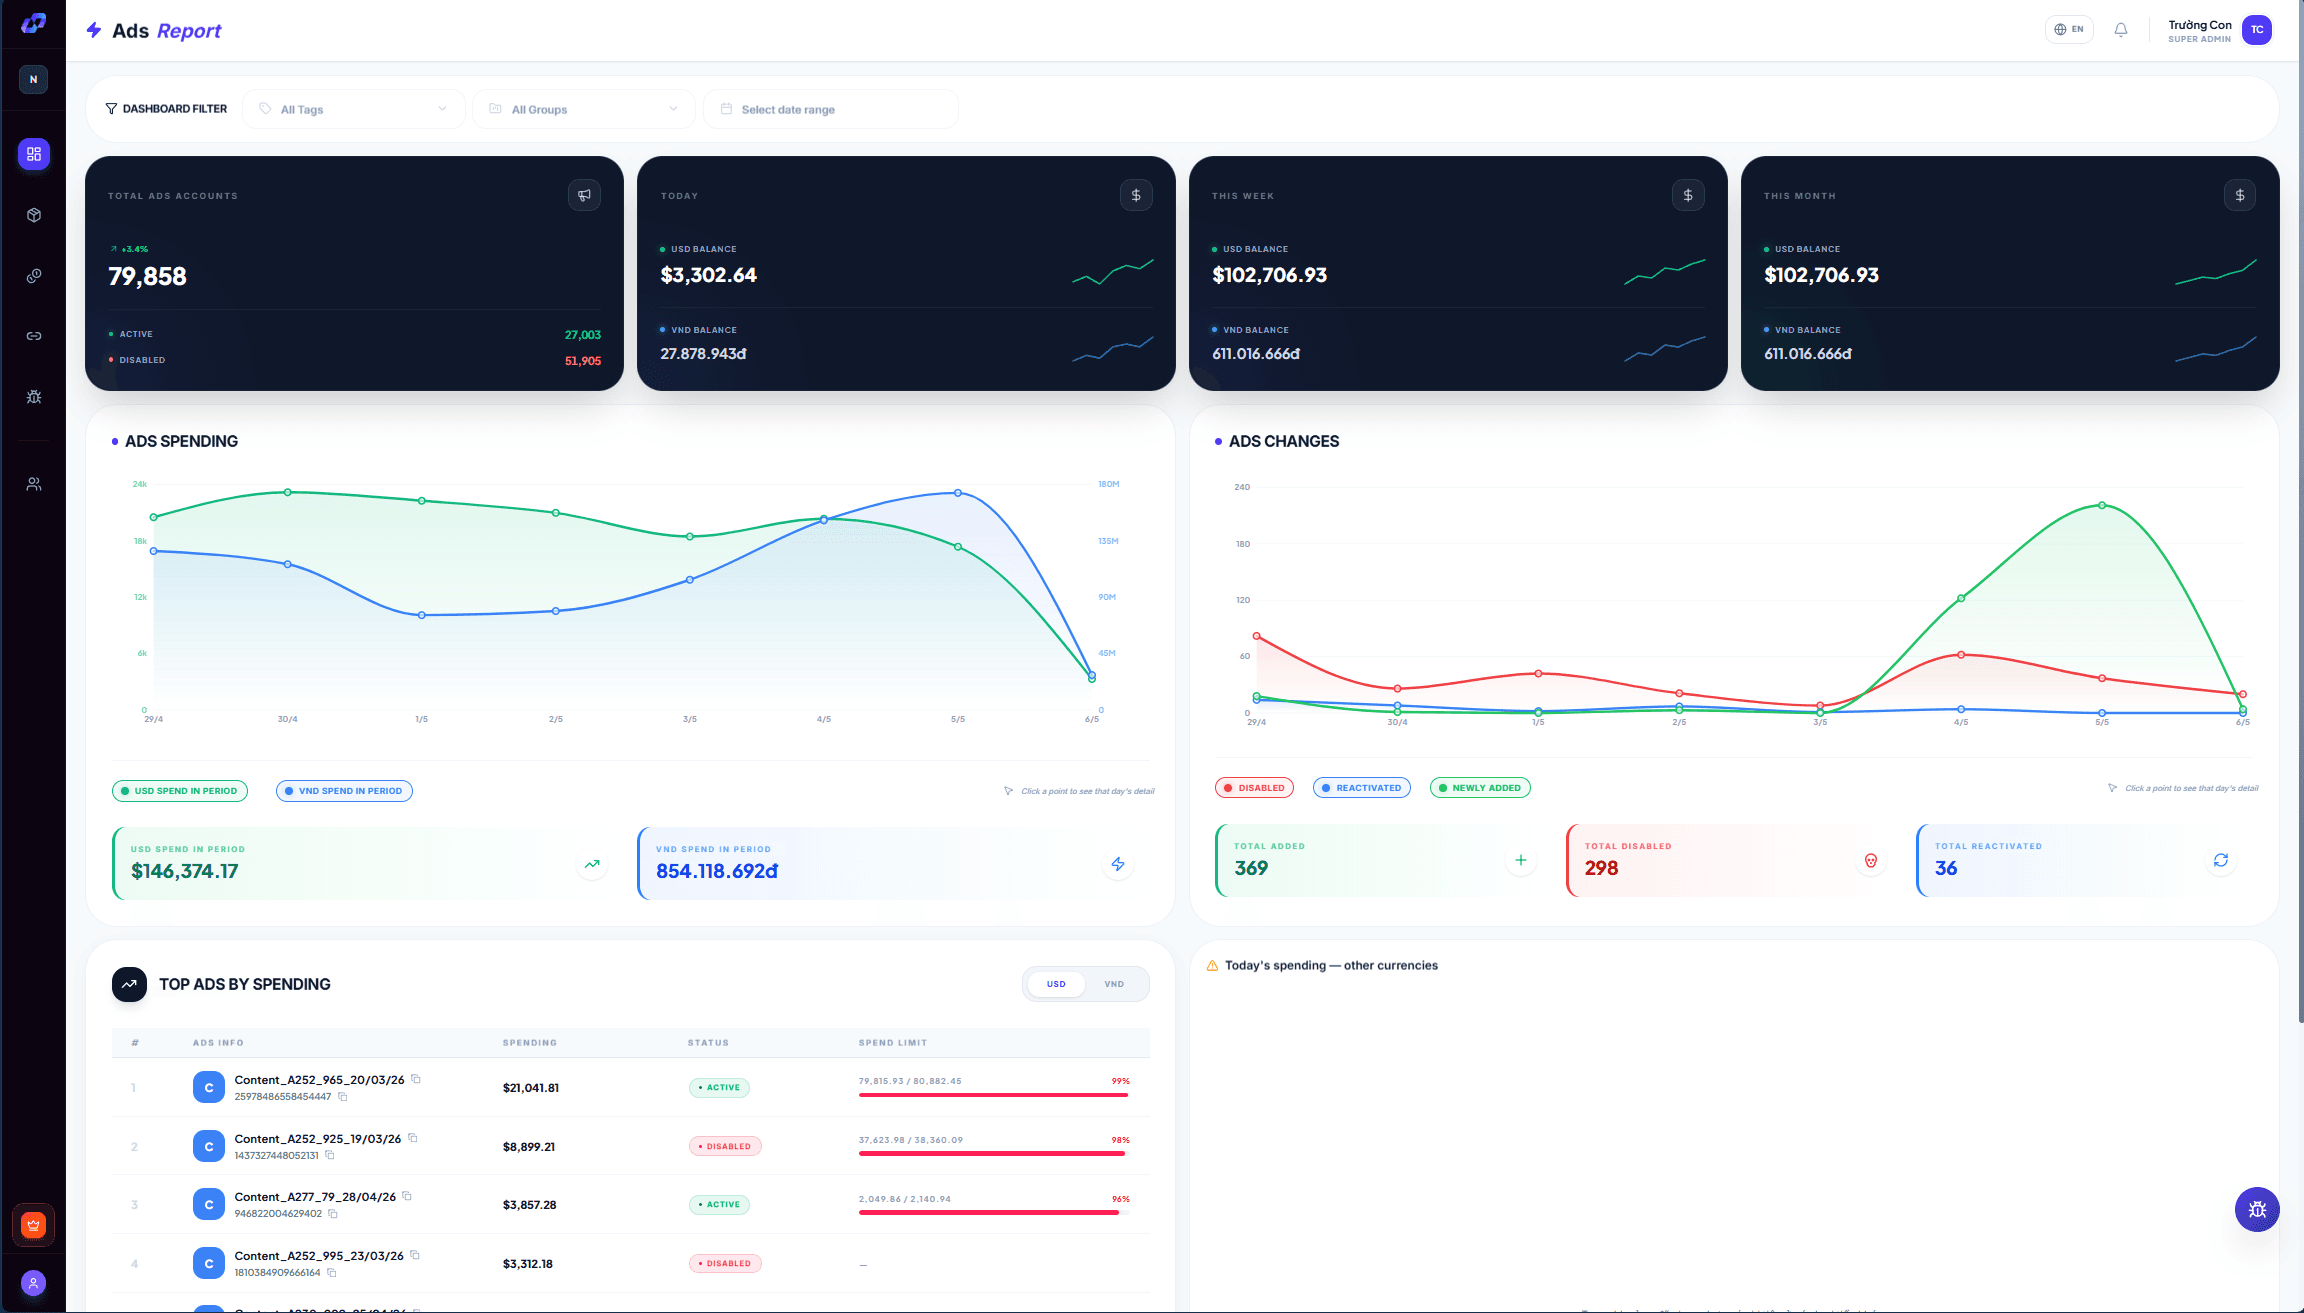
This guide walks you through your first day on Nolimit Ads Manager — from creating an account to running a fully provisioned workspace with assets and teammates in place.
1. Create your account
On the Nolimit Ads Manager home page, click “Start for free”. You can sign in with a work email or use Google SSO. After verifying your email, the system takes you to workspace setup.
- Prefer a company domain (e.g.
@agency.com) — it builds trust when inviting teammates. - Enable 2FA right away from the Profile page.
- One account can join multiple workspaces with different roles.
2. Spin up your first workspace
A workspace is an isolated environment that holds every asset (VIA, Business Manager, ad accounts), payment cards, members and activity log. Agencies typically create one workspace per client to keep access and reconciliation clean.
You'll need to provide:
- Workspace name — shown on the navigation rail and reports.
- Time zone — affects daily spend charts.
- Default currency — VND, USD or another currency to normalize financial reporting.
💡 Once created, switch between workspaces from the top-left switcher — all data and permissions update instantly to match the selected workspace.
3. Invite teammates & set roles
Go to Workspace settings → Members → Invite. Enter an email and pick a role:
- Admin — full control, can invite/remove members and manage billing.
- Manager — manages assets and risk; no billing access.
- Operator — runs campaigns and syncs; no aggregate financials.
- Viewer — read-only dashboards and reports; great for clients or stakeholders.
Every role change or permission grant is recorded in the audit log — ready for internal audits and contractual reviews.
4. Install the Nolimit Connection extension
Nolimit Connection is the free Chrome extension that syncs VIA, BM and ad-account data from your browser into the platform. From Settings → Chrome extension, follow three steps:
- Install from the Chrome Web Store via the in-page button.
- Sign in to the extension with the same account you use on the web.
- Pick the workspace to bind to — the extension remembers and syncs in the background.
Once installed, the extension recognizes your Facebook assets automatically when you visit Business Manager or Ads Manager. The data flow is encrypted end-to-end — see the Privacy Policy for details.
5. Your daily workflow
With those four steps done, you're ready. A typical morning loop:
- Open the Dashboard for overnight alerts and yesterday's spend.
- Hit Assets to re-sync VIA/BM/ad accounts if anything changed.
- Visit Risk monitoring to act on assets whose health dropped.
- Wrap up at the Finance hub to reconcile spend and bills.
Each of those has its own guide — see “Continue reading” at the bottom of this page.
Workspace dashboard overview
How to read KPI cards, spend charts, hot-asset lists and the quick filters on the main dashboard page.
The dashboard is the command screen for every workspace — wrapping every key metric into a single view. A 30-second glance each morning is all you need to gauge the state of operations.
1. Top-row KPI cards
The top row typically renders 4–6 core KPIs. Each card shows the current value plus a trend versus the previous period.
- Total spend (today / 7d / 30d) — normalized to the workspace currency.
- Active assets — active VIAs, verified BMs, running ad accounts.
- At-risk assets — assets whose risk score spiked and need attention.
- Reconciliation rate — percentage of spend matched against actual bills.
💡 Click any KPI card to jump straight into the matching detail page with the filter pre-applied — no manual drilling.
2. Spend chart
The central chart plots spend over your selected window (defaults to 30 days). You can:
- Switch grain: daily / weekly / monthly.
- Compare ranges (current vs previous period).
- Break down by BM, ad account or owner.
- Export CSV to send to a client or your finance team.
3. Hot-assets list
On the right rail (or below the chart on smaller screens) you'll find a concise list of assets that need attention right now:
- Assets whose risk score climbed since yesterday.
- Assets that were just disabled or need further verification.
- Assets exceeding spend thresholds you configured.
Each row has a one-click shortcut to the detail page so you can act without digging through tables.
4. Top filter bar
A page-wide filter bar lives above the dashboard:
- Date range — presets (7d, 30d, MTD, QTD) or custom.
- Business Manager — limit data to one or more BMs.
- Owner — filter by the assigned operator (subject to permissions).
- Tag — your custom taxonomy (e.g. client-A, experiment).
Every filter persists into the URL — share the link and a teammate sees the exact same view.
5. Tailor it to you
Hit “Customize” in the top-right corner to choose:
- Which KPI cards to show, and in what order.
- Whether to display sub-charts (by campaign, by device).
- The chart time zone (workspace or personal profile).
Layout settings are per-user — an admin and an operator can have very different dashboards while sharing the same workspace.
Manage VIA · Business Manager · Ad accounts
Every feature on the asset pages: tables, filters, data sync, VIA lock, Chrome remote and per-asset detail views.
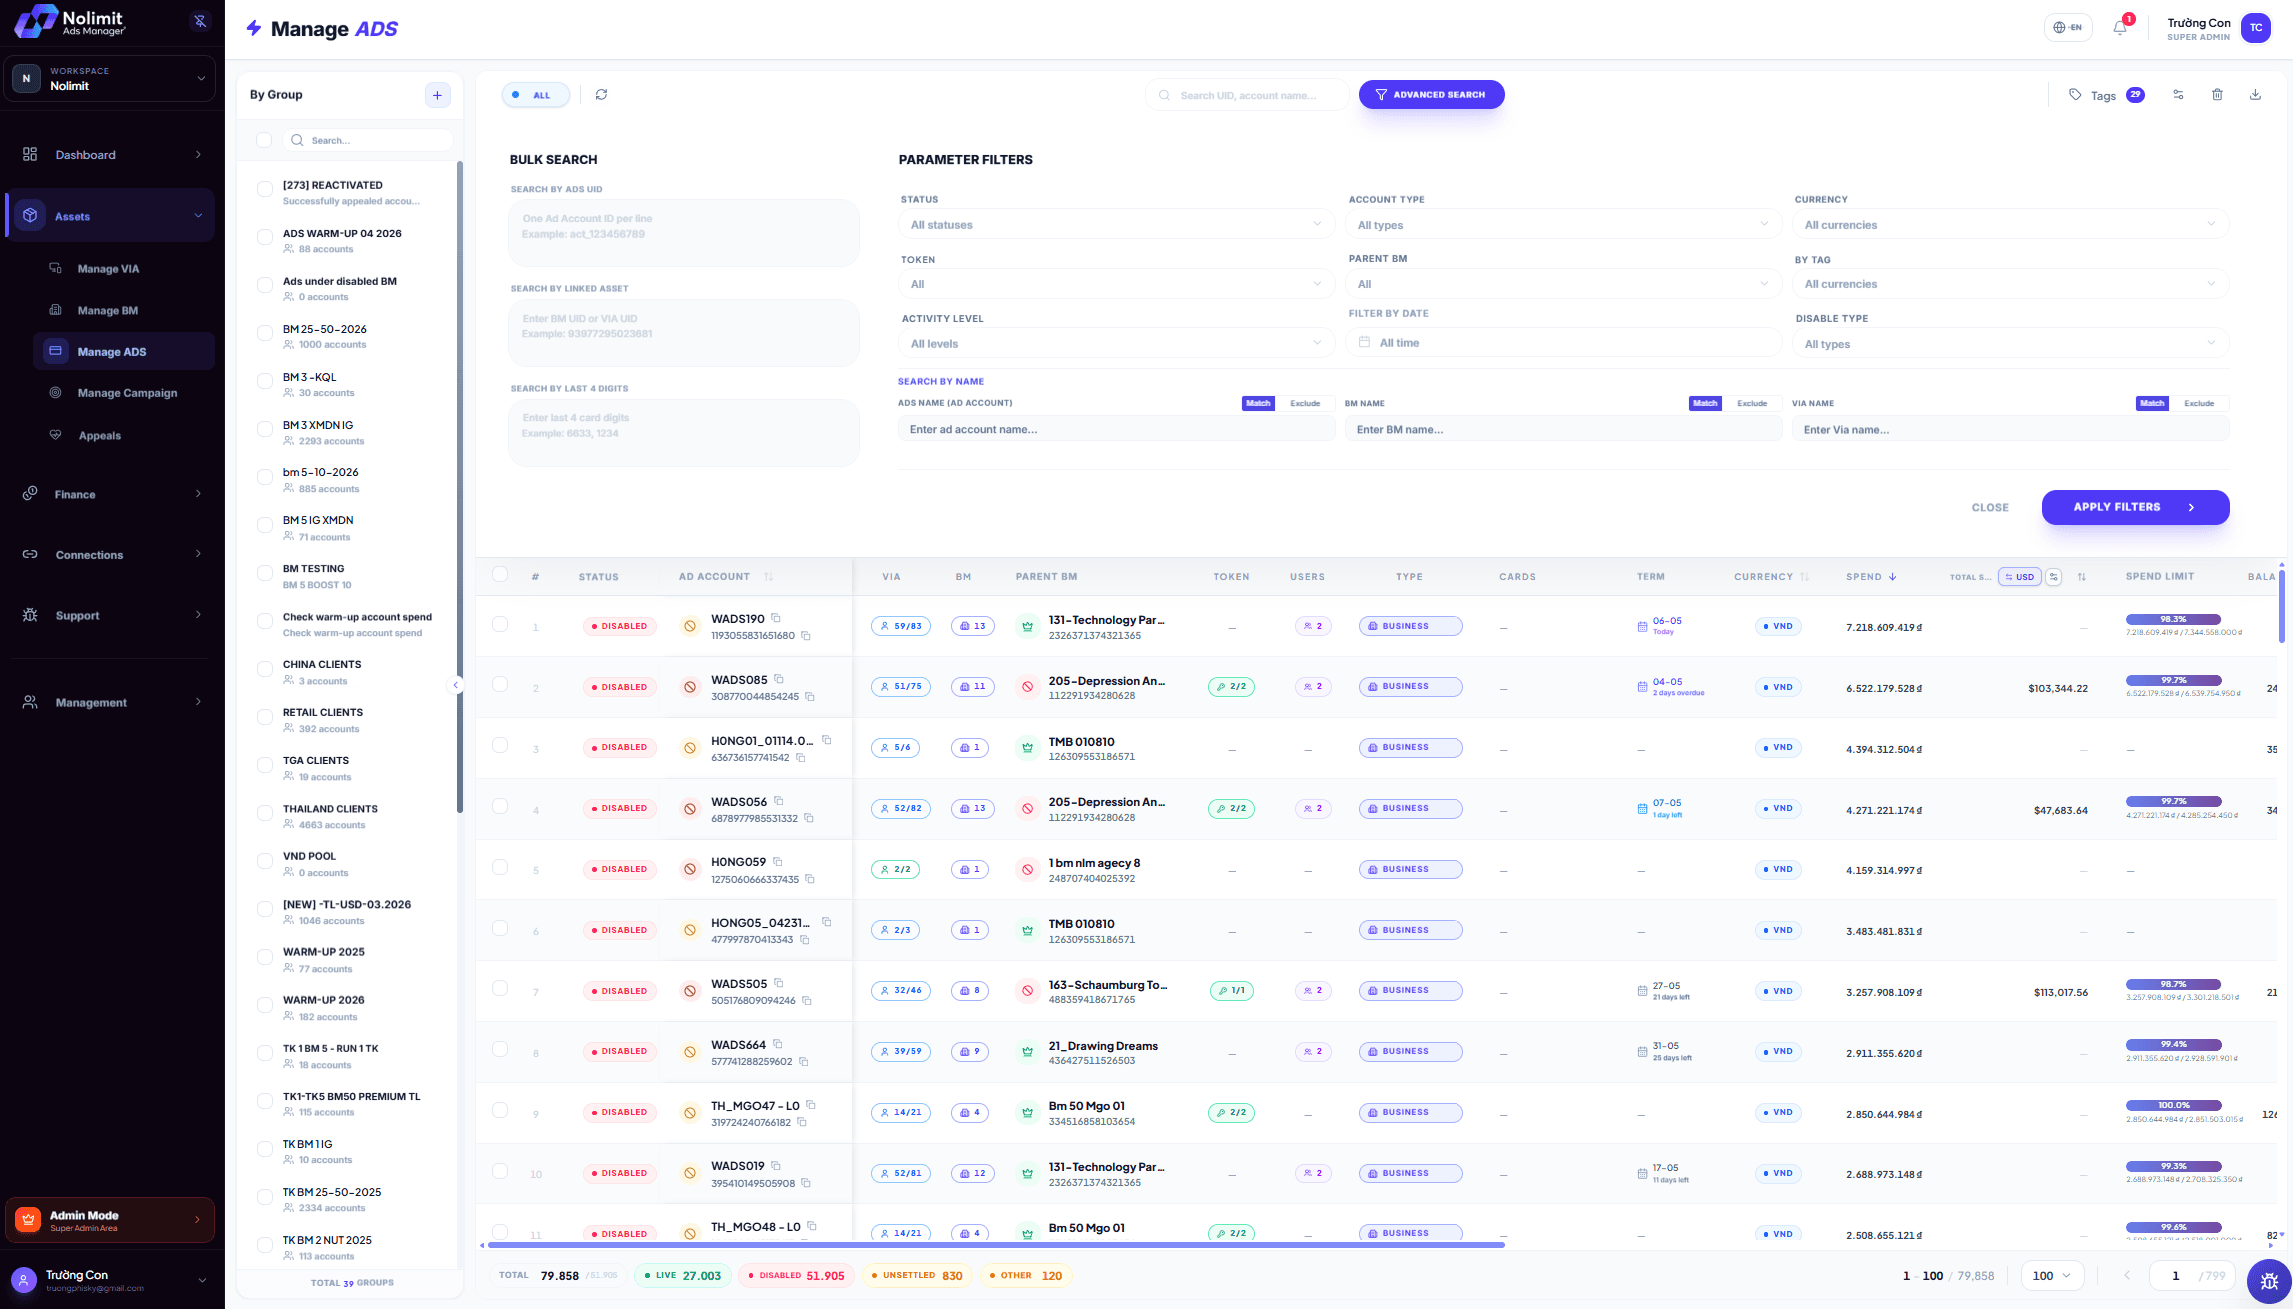
Every Facebook asset in a workspace is managed across three dedicated pages: VIAs (Facebook profiles), Business Managers and ad accounts. The pages share the same skeleton — this guide covers the common pattern and the per-asset specifics.
1. Common page layout
Each asset page has four main parts:
- Header bar — counts, refresh, sync and create-new actions.
- Filter strip — by status, BM, owner, tag, last sync.
- Data table — sortable, multi-select for bulk actions.
- Detail side panel — clicking a row slides out the right panel.
2. The VIA page — Facebook profiles
Each VIA is a real Facebook account used to manage BMs and ad accounts. The default columns:
- VIA name + UID — click to copy.
- Status — Active / Checkpoint / Disabled.
- OAuth token — valid / expiring / missing.
- Last sync — time since last sync.
Quick actions per VIA
- Lock VIA — flag it as held by you so teammates don't touch it.
- Sync — call the Marketing API using the authorized OAuth token to refresh data.
- Change password — rotate the Facebook password and log it.
💡 When opening a VIA detail page, if a valid OAuth token is present and the last sync was over an hour ago, the system auto-syncs — no manual step.
3. The Business Manager page
A BM groups multiple ad accounts, pages, pixels and payment methods. The BM table shows:
- BM name + BM ID + verification status.
- Child ad-account count + how many are active.
- Total spend for the filter range.
- BM health score — rolled up from child accounts.
When to open the BM detail page
- Pull a System User Token for external integrations.
- Inspect the distribution of child ad accounts (how many active vs disabled).
- Audit BM member-change history (admins, employees).
4. The ad-account page
This is where most of the day-to-day work happens. Common columns:
- Account name + Act ID, parent BM, owner.
- Status — Active / Disabled / Restricted / Closed.
- Spend today / 7d / 30d.
- Balance / limit / payment method.
- Account time zone — critical for matching against bills.
What's on the ad-account detail page
- Overview tab: spend chart, campaign list, basic financials.
- Ads Manager tab: an embedded campaign/adset/ads table — no need to open Facebook.
- History tab: every meaningful change (status, limits, payment methods).
5. Bulk actions
Every table has a row-select checkbox. Tick multiple rows and a bottom action bar appears with options to:
- Sync in bulk (each row uses the credentials you configured).
- Apply / remove tags.
- Reassign ownership.
- Export selected rows to CSV.
6. Tags — your own taxonomy
A few default tags ship with the platform, but you can create your own to sort assets by client, campaign, environment (live / test), or any logic you need. Tags work across all asset pages — a tag created on VIAs also filters BMs and ad accounts.
Risk monitoring & health scores
How the platform scores risk, alerts you on assets at risk of being disabled, and the fast-response workflow when incidents occur.
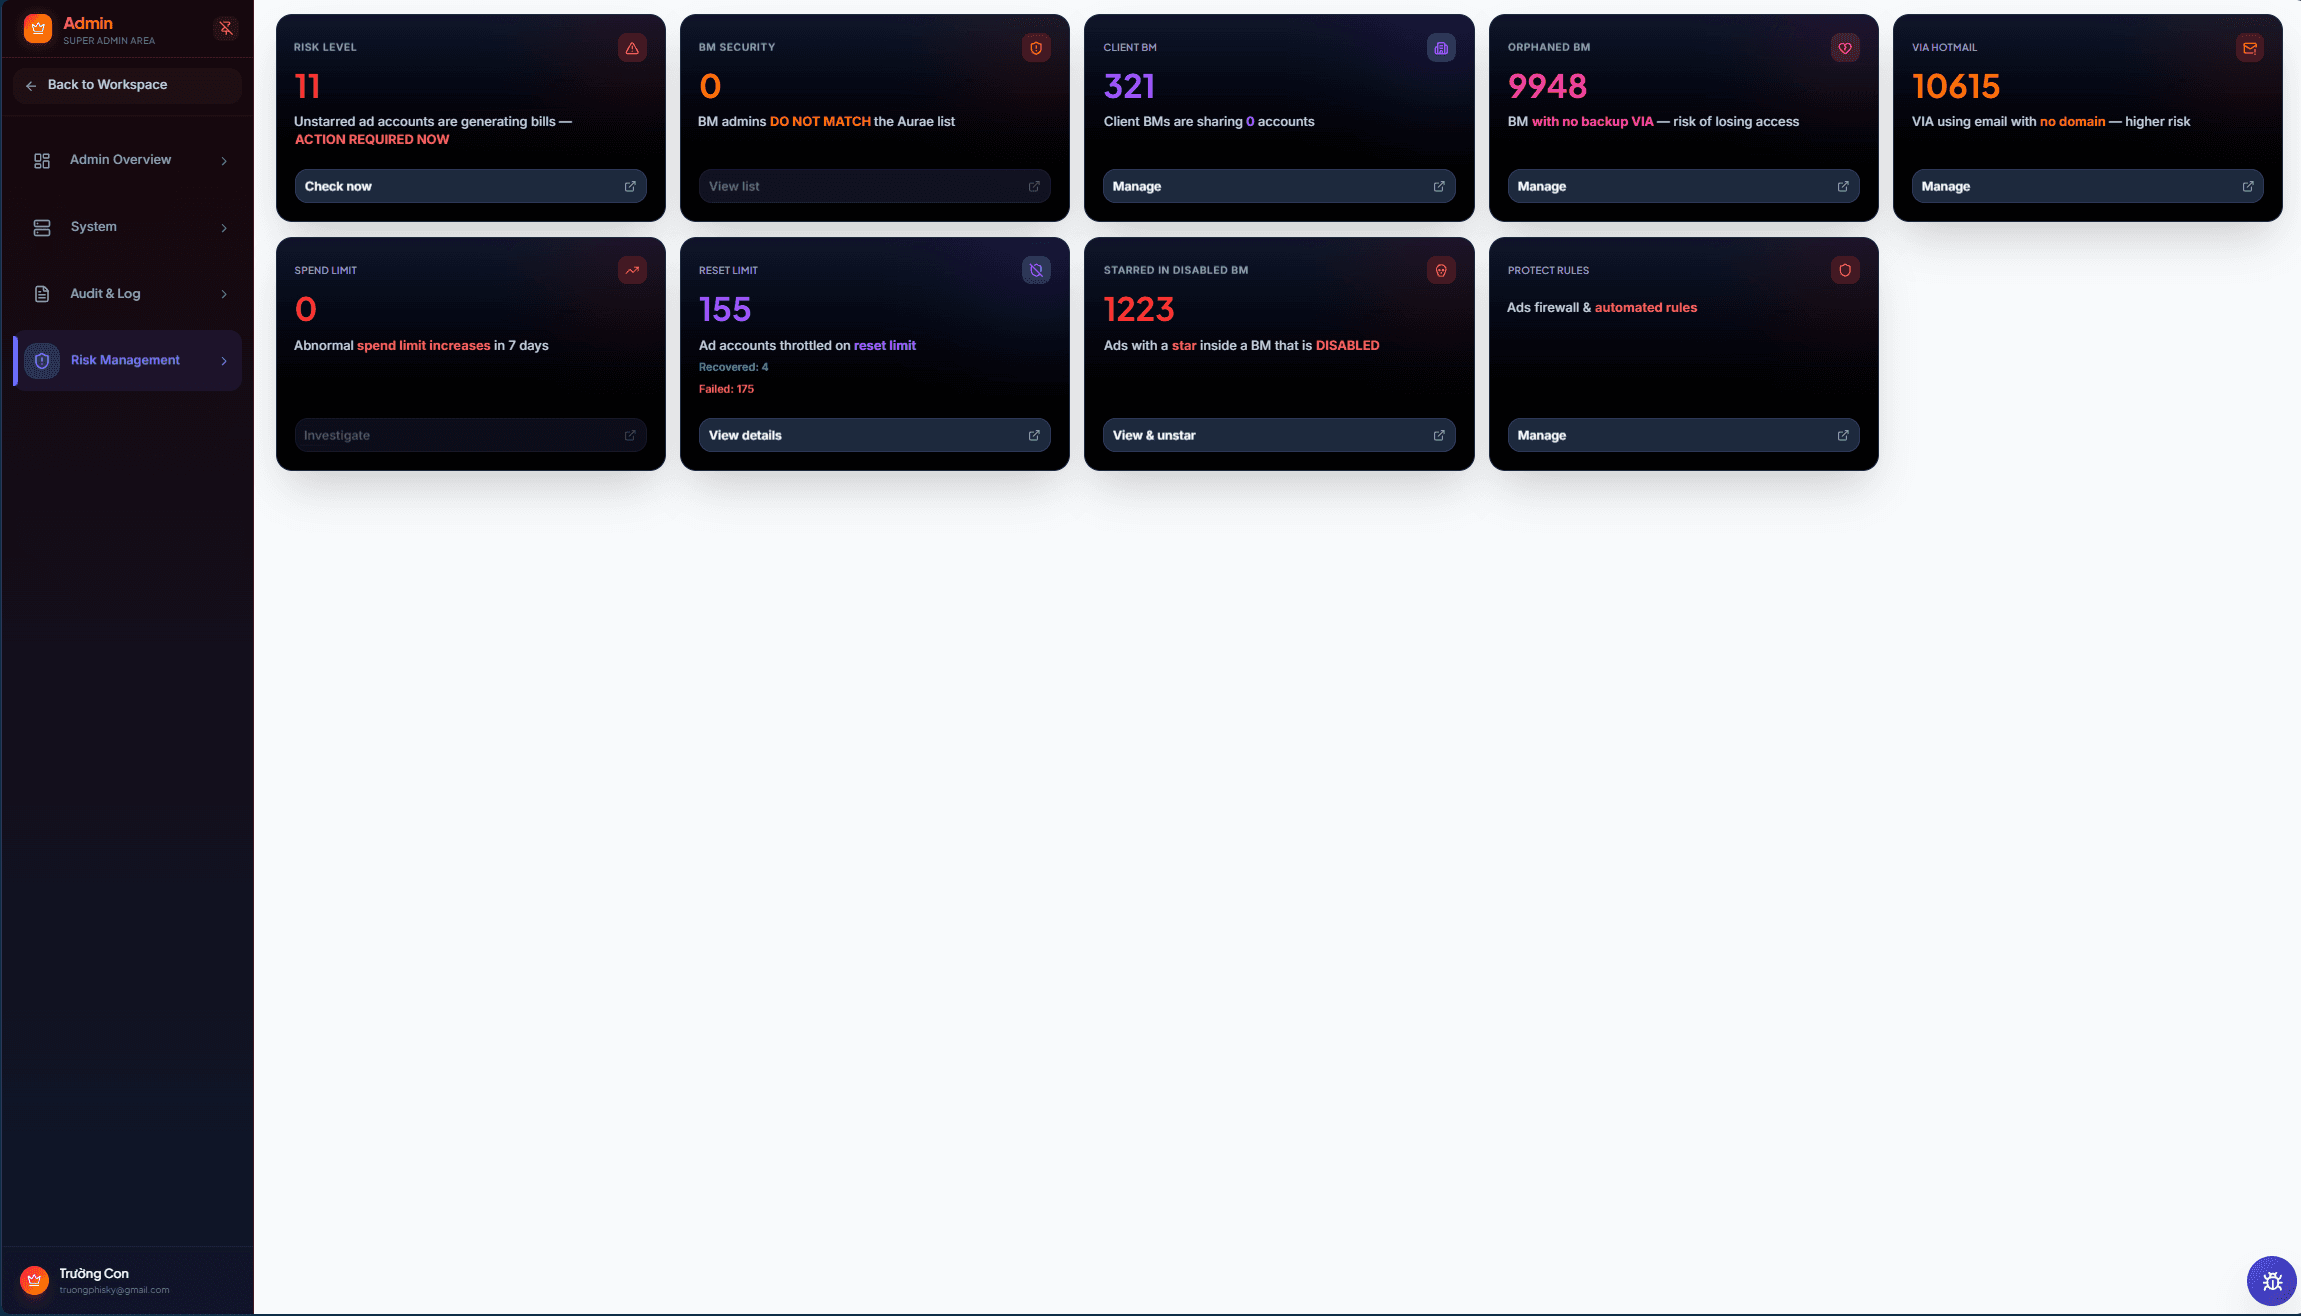
The Risk monitoring and Health score pages form your workspace's main defense — surfacing assets at risk of being disabled, measuring system-wide exposure and recommending fixes.
1. The system risk score
Every asset (VIA, BM, ad account) gets a 0–100 risk score. It rolls up multiple signals:
- Recent checkpoint, restriction or disable events in the last 30 days.
- Sudden spend swings against the baseline.
- Frequency of password or credential rotations — too much churn is its own signal.
- Payment-method and verification status.
- Signals from the Meta Marketing API.
The scale:
- 0–30 — stable, no action needed.
- 31–60 — watch list, check periodically.
- 61–80 — warning, plan a fallback.
- 81–100 — high risk, act immediately.
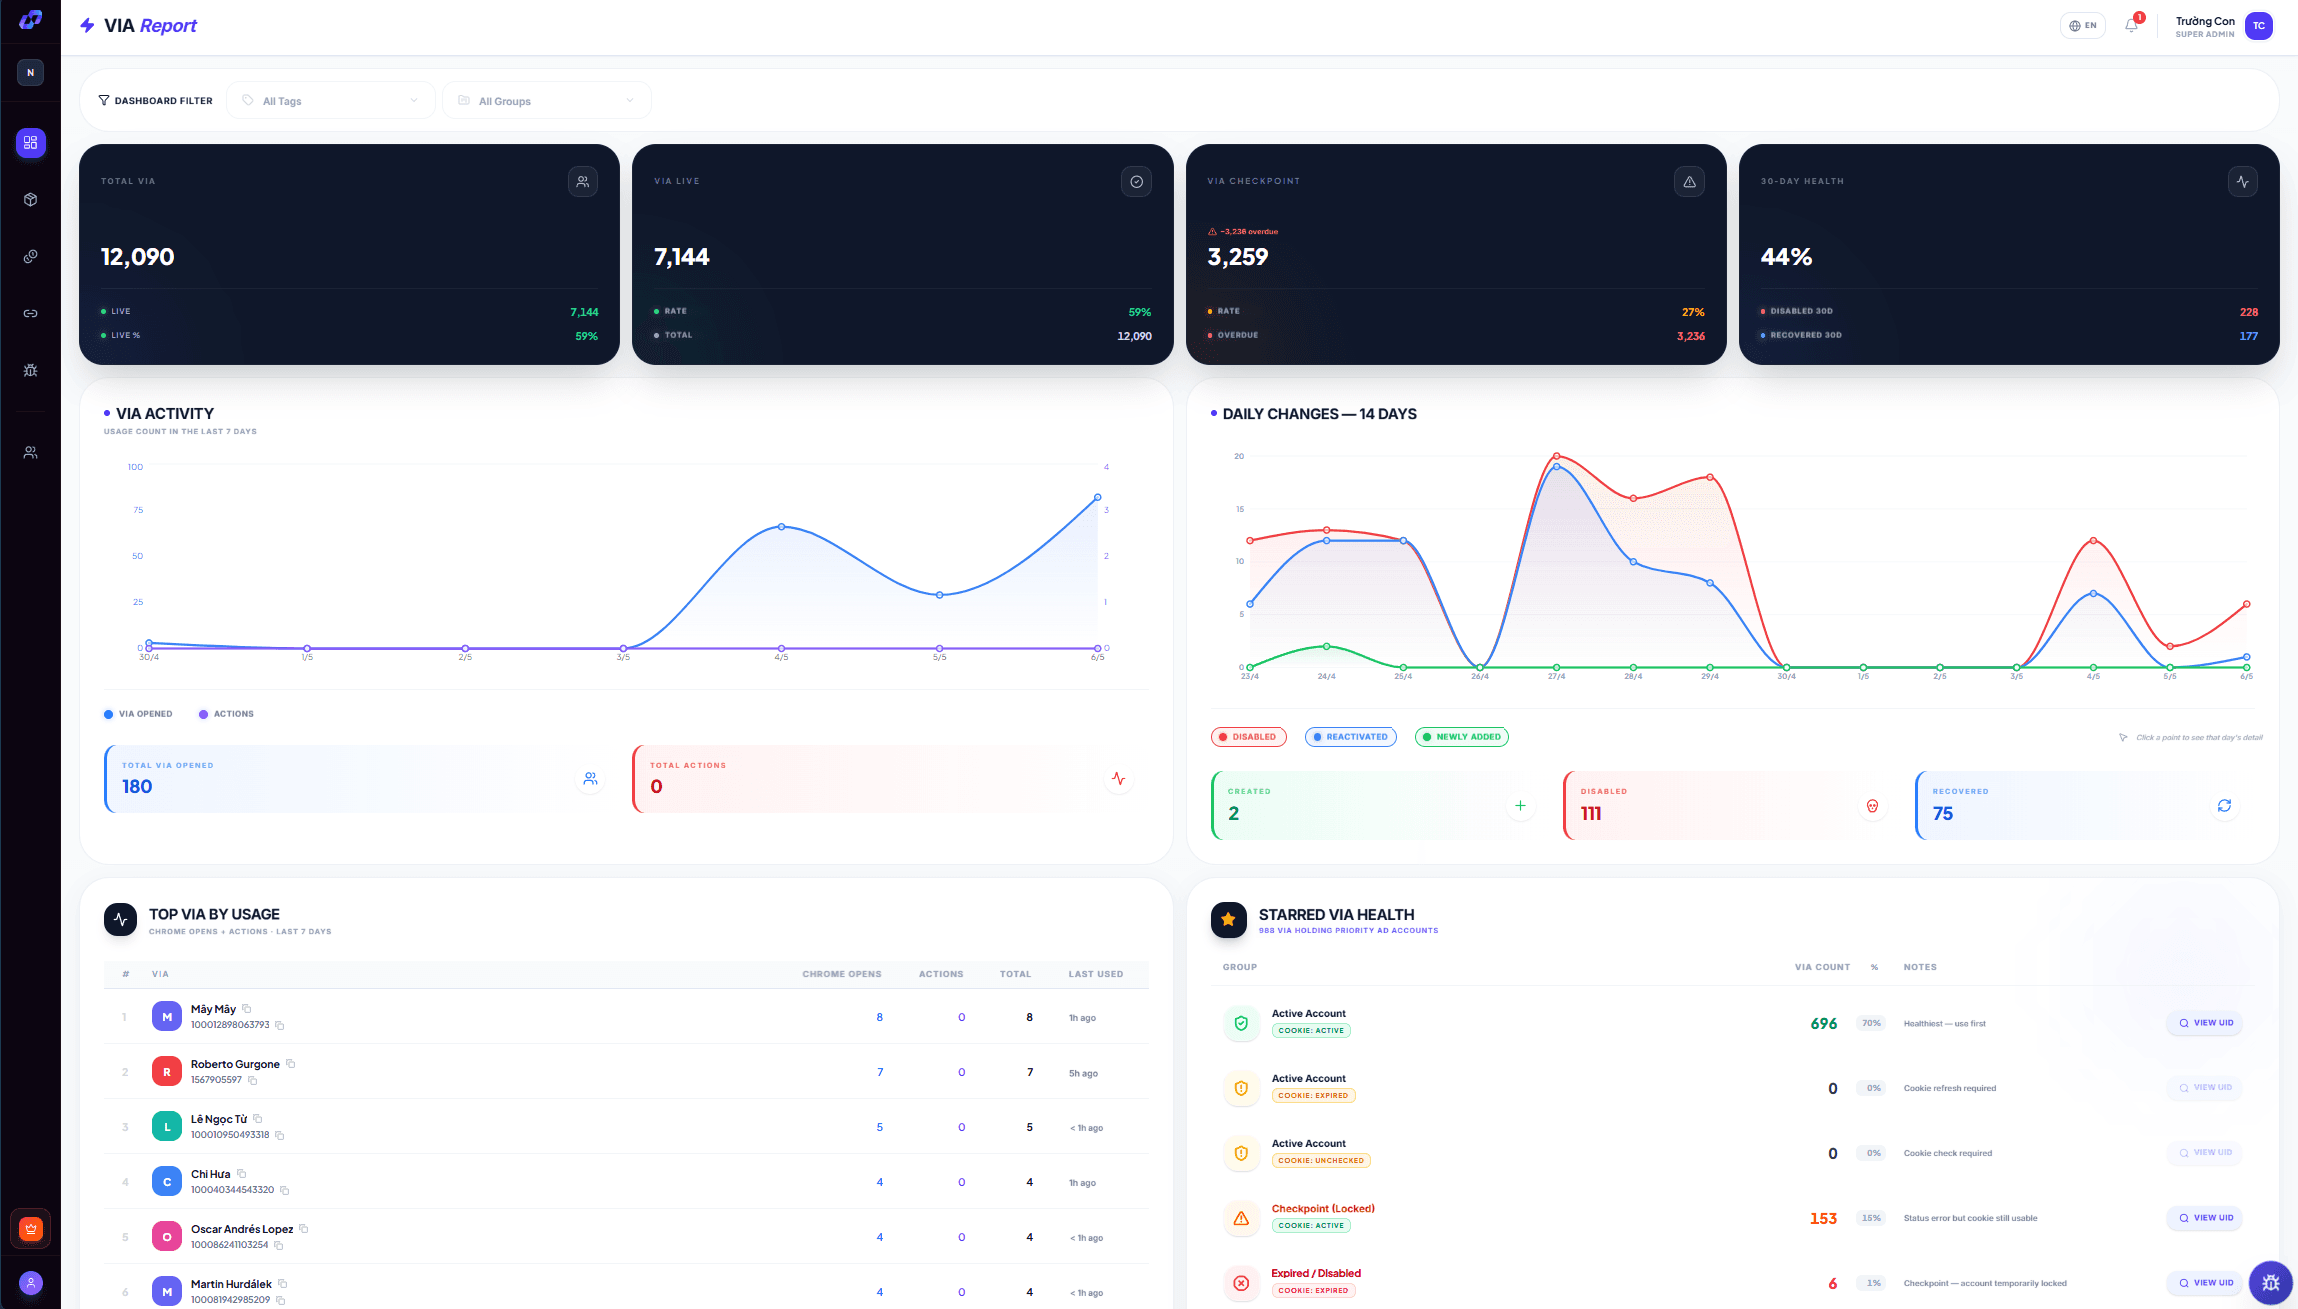
2. The 24/7 risk radar
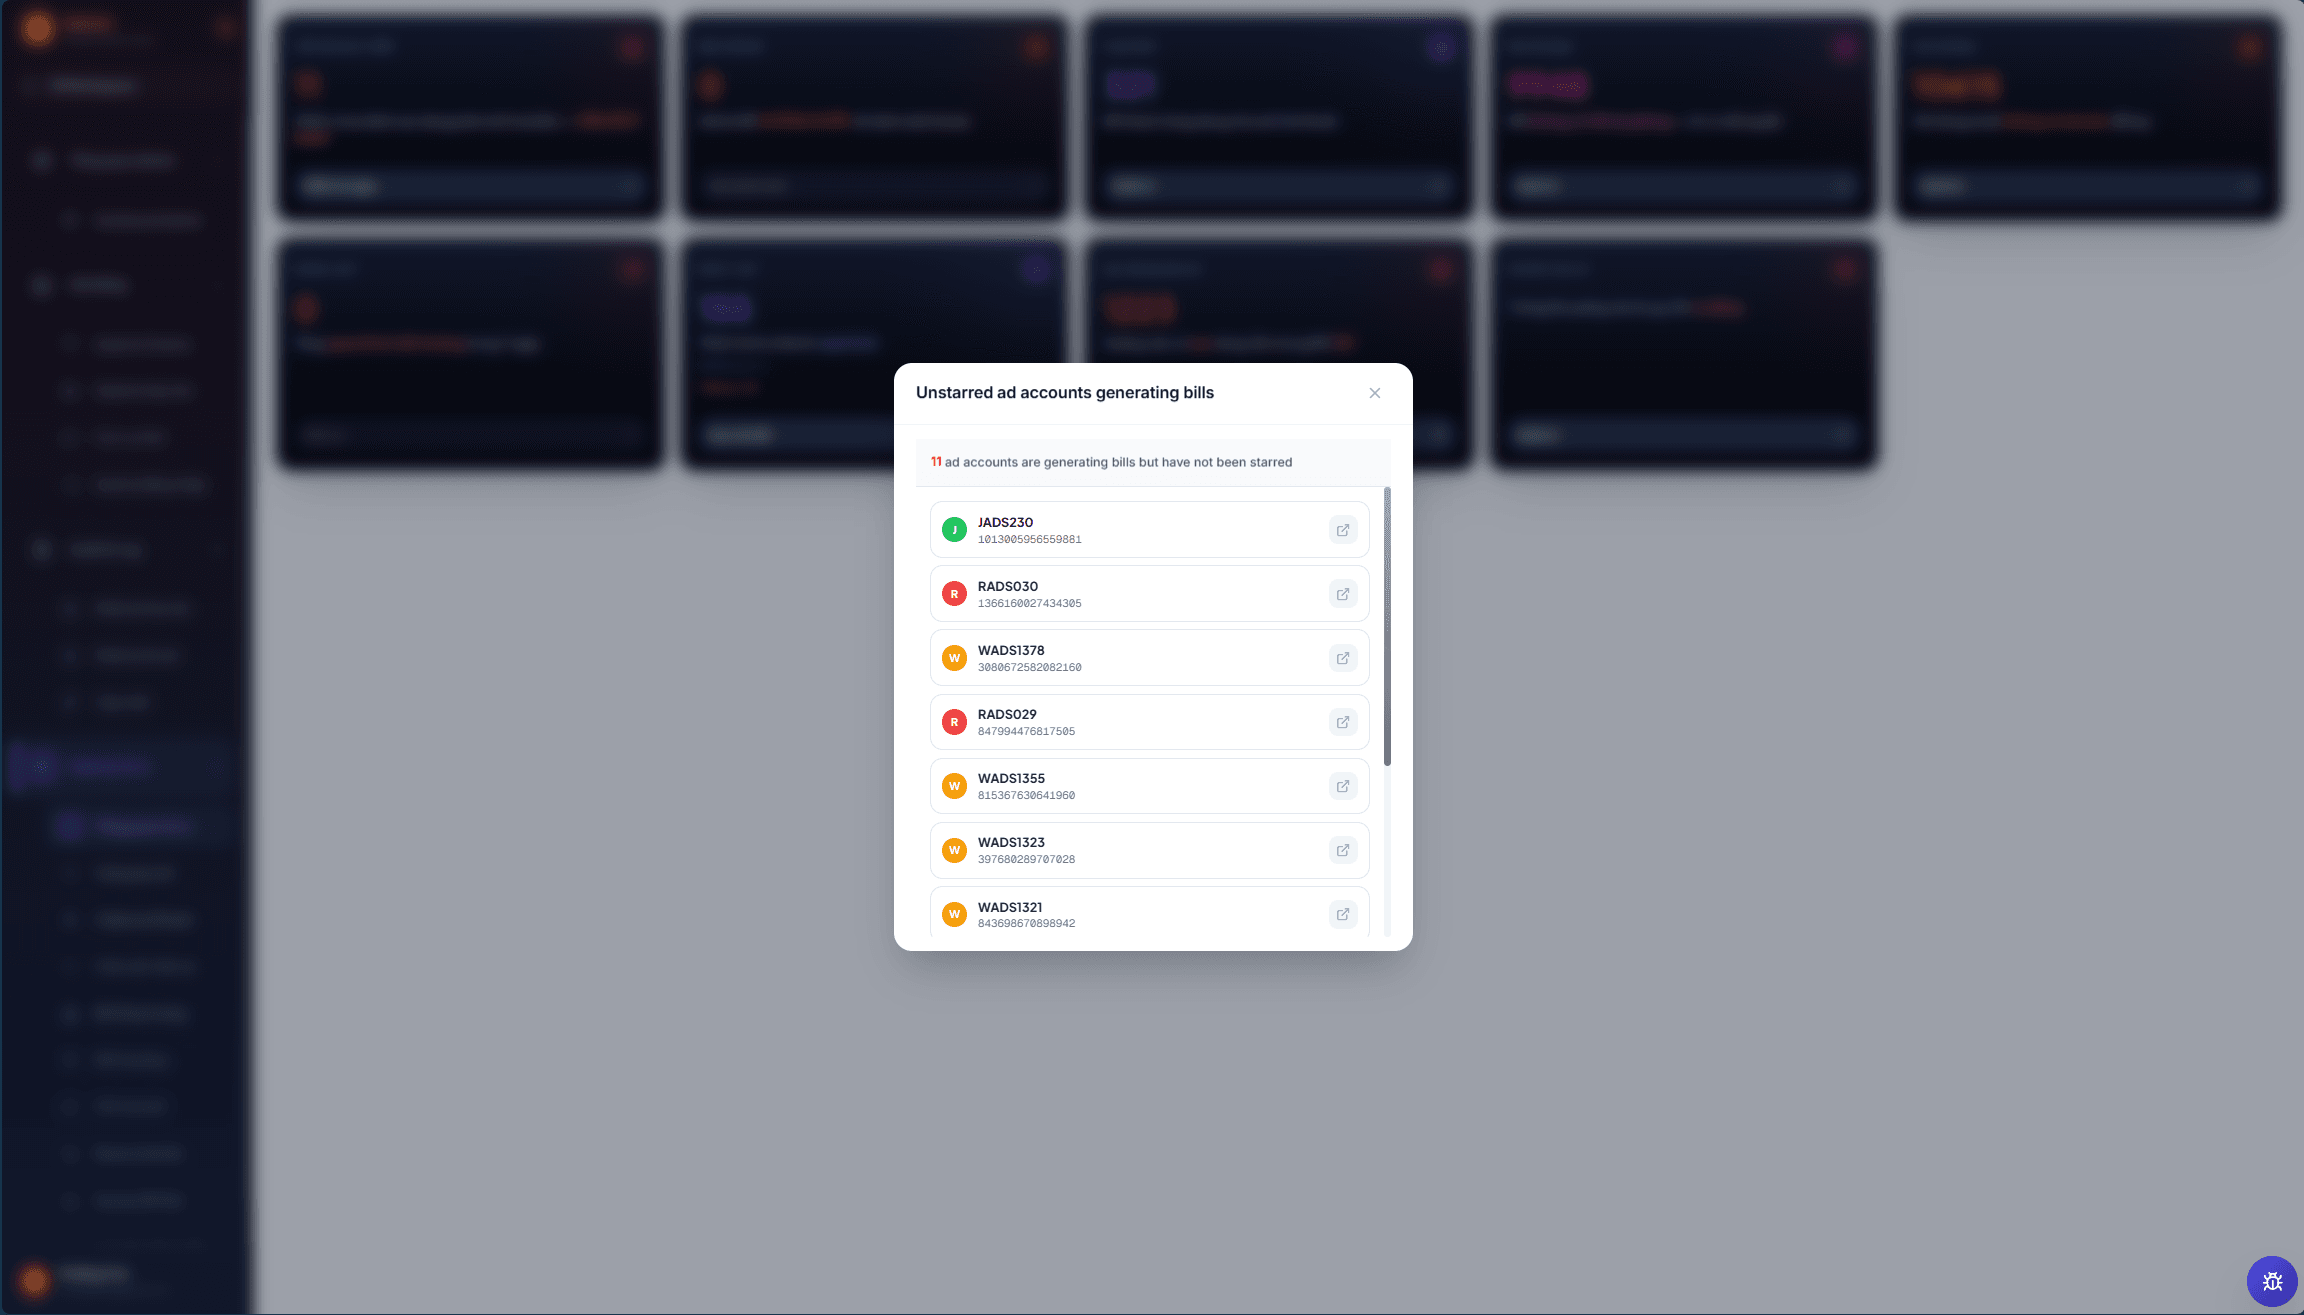
A background sweeper continuously scans risk signals and fires alerts in real time. Alerts have tiered severity:
- Info — minor changes, logged for later review.
- Warning — sent to your notification channels (in-app, email, Telegram).
- Critical — phone call or SMS if you've configured escalation.
3. Incident response workflow
When you open an alert, the system suggests a playbook based on the issue:
- Read the alert — which event chain pushed the risk score up.
- Open the VIA's Facebook session to verify the actual state in Business Suite.
- Apply the suggested action: pause a campaign, split the BM, shift budget to another asset, or file an appeal with Meta if needed.
- Leave a note in the asset log — the next-shift teammate should understand what happened.
- Snooze the next check if appropriate (e.g. revisit in 12h).
4. Configure your own thresholds
Each workspace can dial in custom triggers so alerts only fire when they matter:
- Spend exceeding X per hour (anomaly defense).
- Count of assets disabled within the same BM in a window.
- Workspace-wide risk score crossing a threshold (e.g. 70/100).
5. Recurring risk reports
The Reports page auto-builds weekly / monthly digests covering:
- Distribution of risk scores across the workspace.
- Top movers (assets with the biggest score change).
- SLA compliance — how fast alerts were handled.
- Comparison vs the previous period.
Reports can be auto-emailed to clients or leadership — a good fit for the transparency clauses in larger contracts.
Ad finance command center
Track payment cards, Meta invoices, spend history and run automated reconciliation — all in a single finance hub.
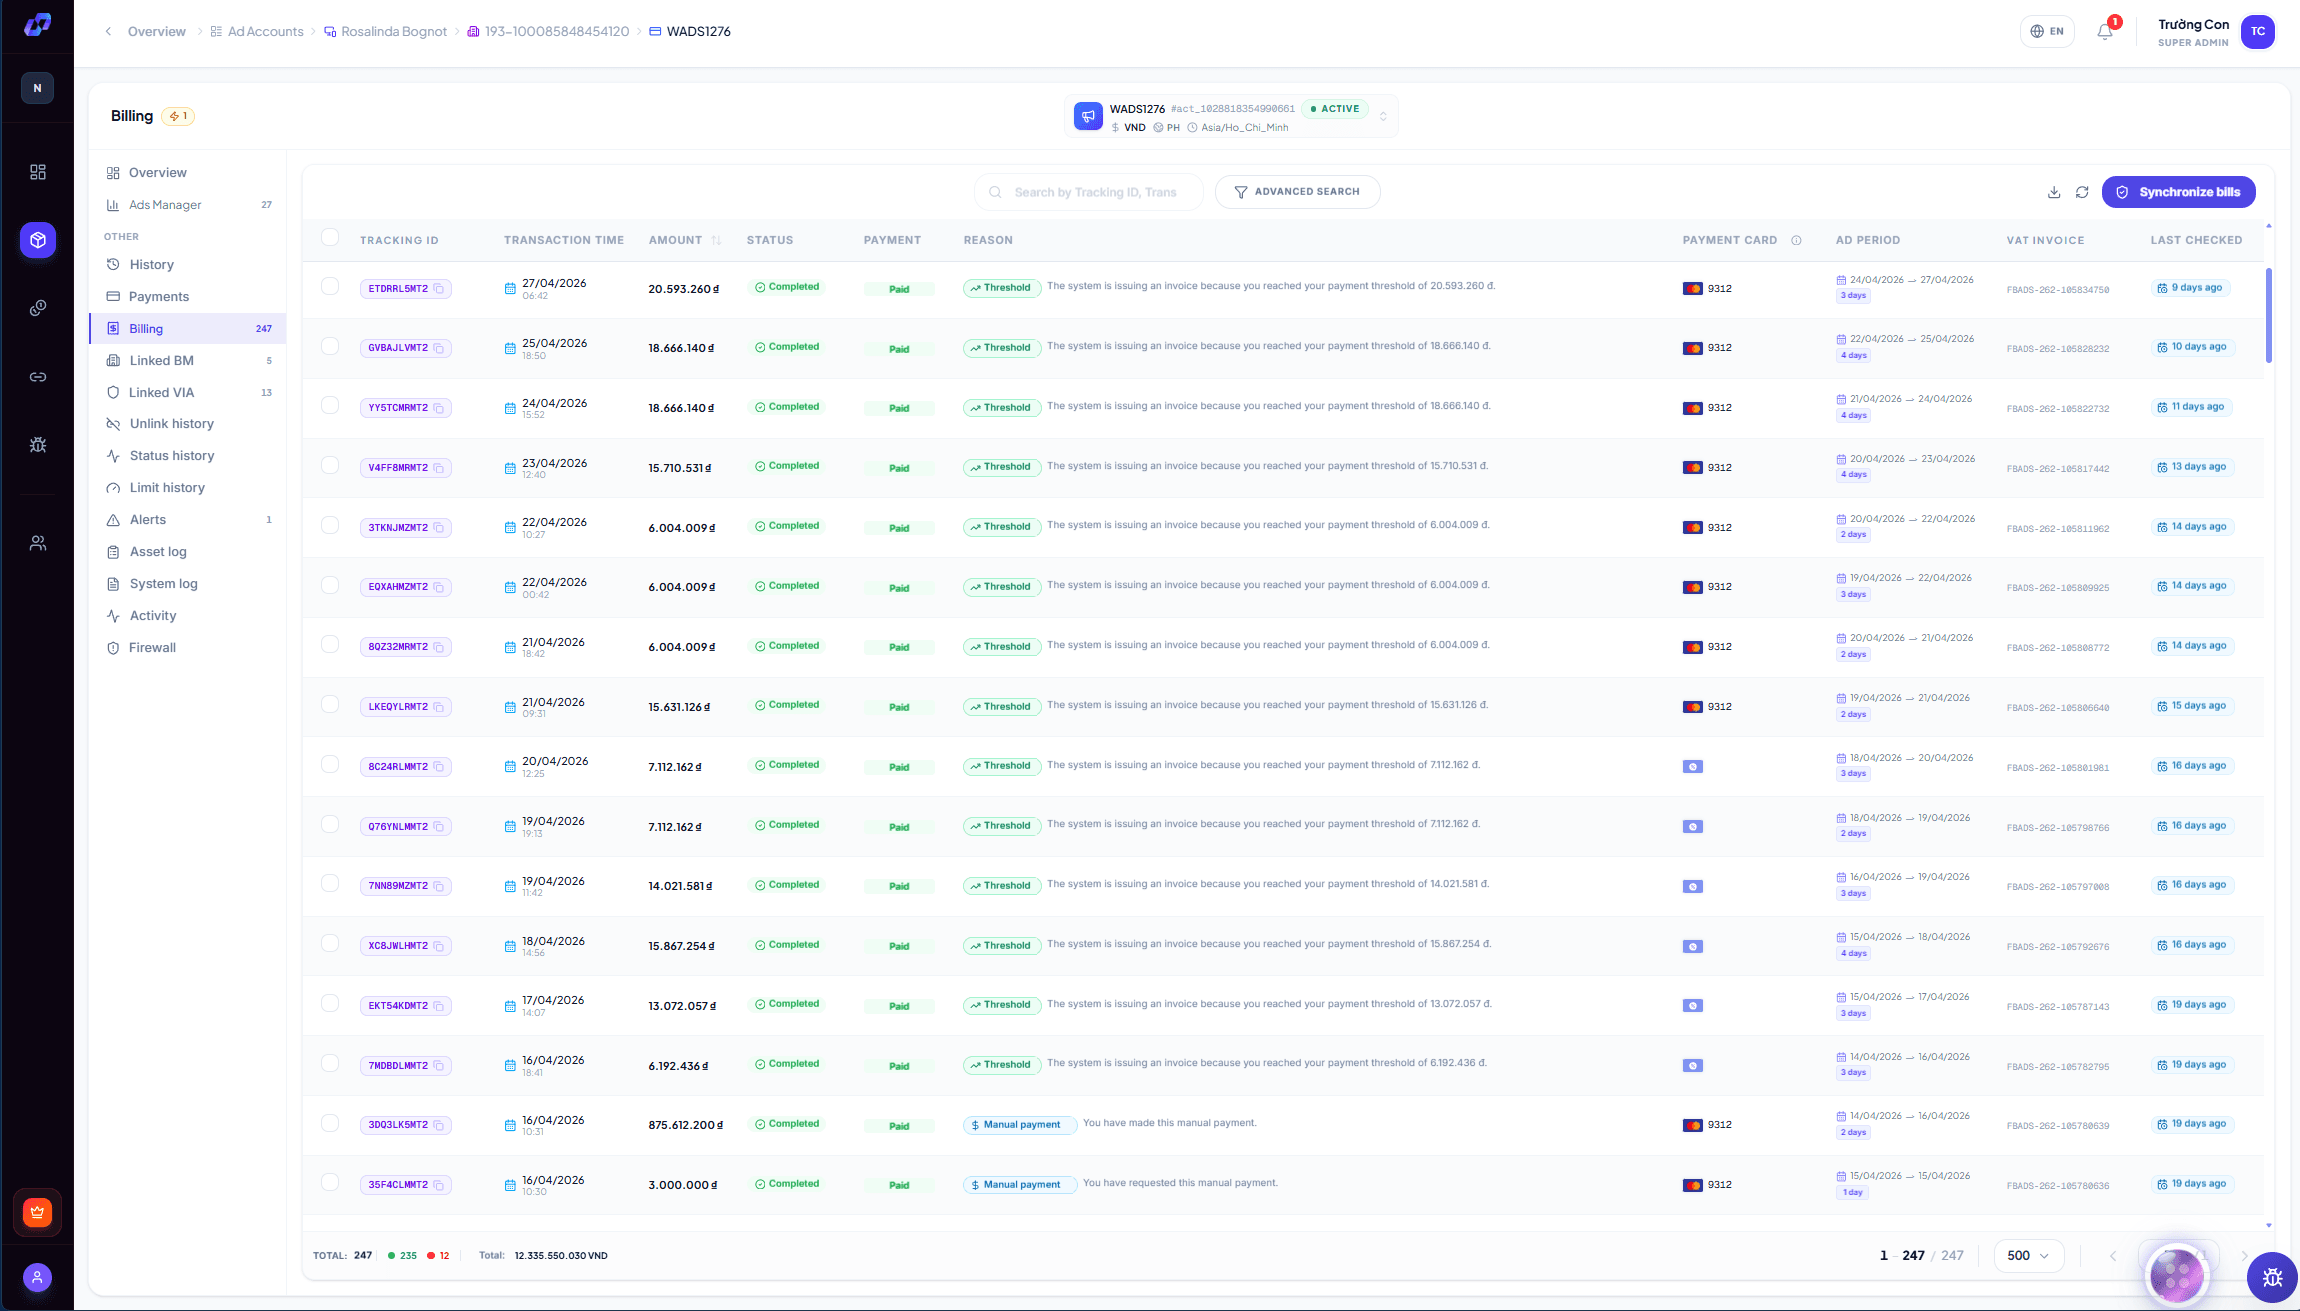
The finance hub pulls every payment card, Meta invoice, spend record and reconciliation into one place — replacing the manual BM-by-BM digging on Facebook and the hand-rolled Excel exports.
1. Payment cards
The Payment cards page lists every card used in the workspace — both corporate cards and Facebook payment instruments. Per row:
- Cardholder name, last-4, card brand (Visa / Mastercard / JCB…).
- Expiry — colored when expiring soon (amber) or already expired (red).
- Which BMs / ad accounts the card is linked to — click to view links.
- Spend through this card in the filter range.
Linking a card to Facebook
When adding a card, the system checks whether Facebook already holds a matching instrument (by last-4 + expiry). If it matches, hit Link to bind — spend through that instrument is then auto-mapped to the card in your system.
2. Meta bills
Bills are captured through two channels:
- Meta Marketing API — periodic invoice pull per ad account.
- Real-time bill capture — the Chrome extension reads bills the moment Facebook charges, instead of waiting 24h.
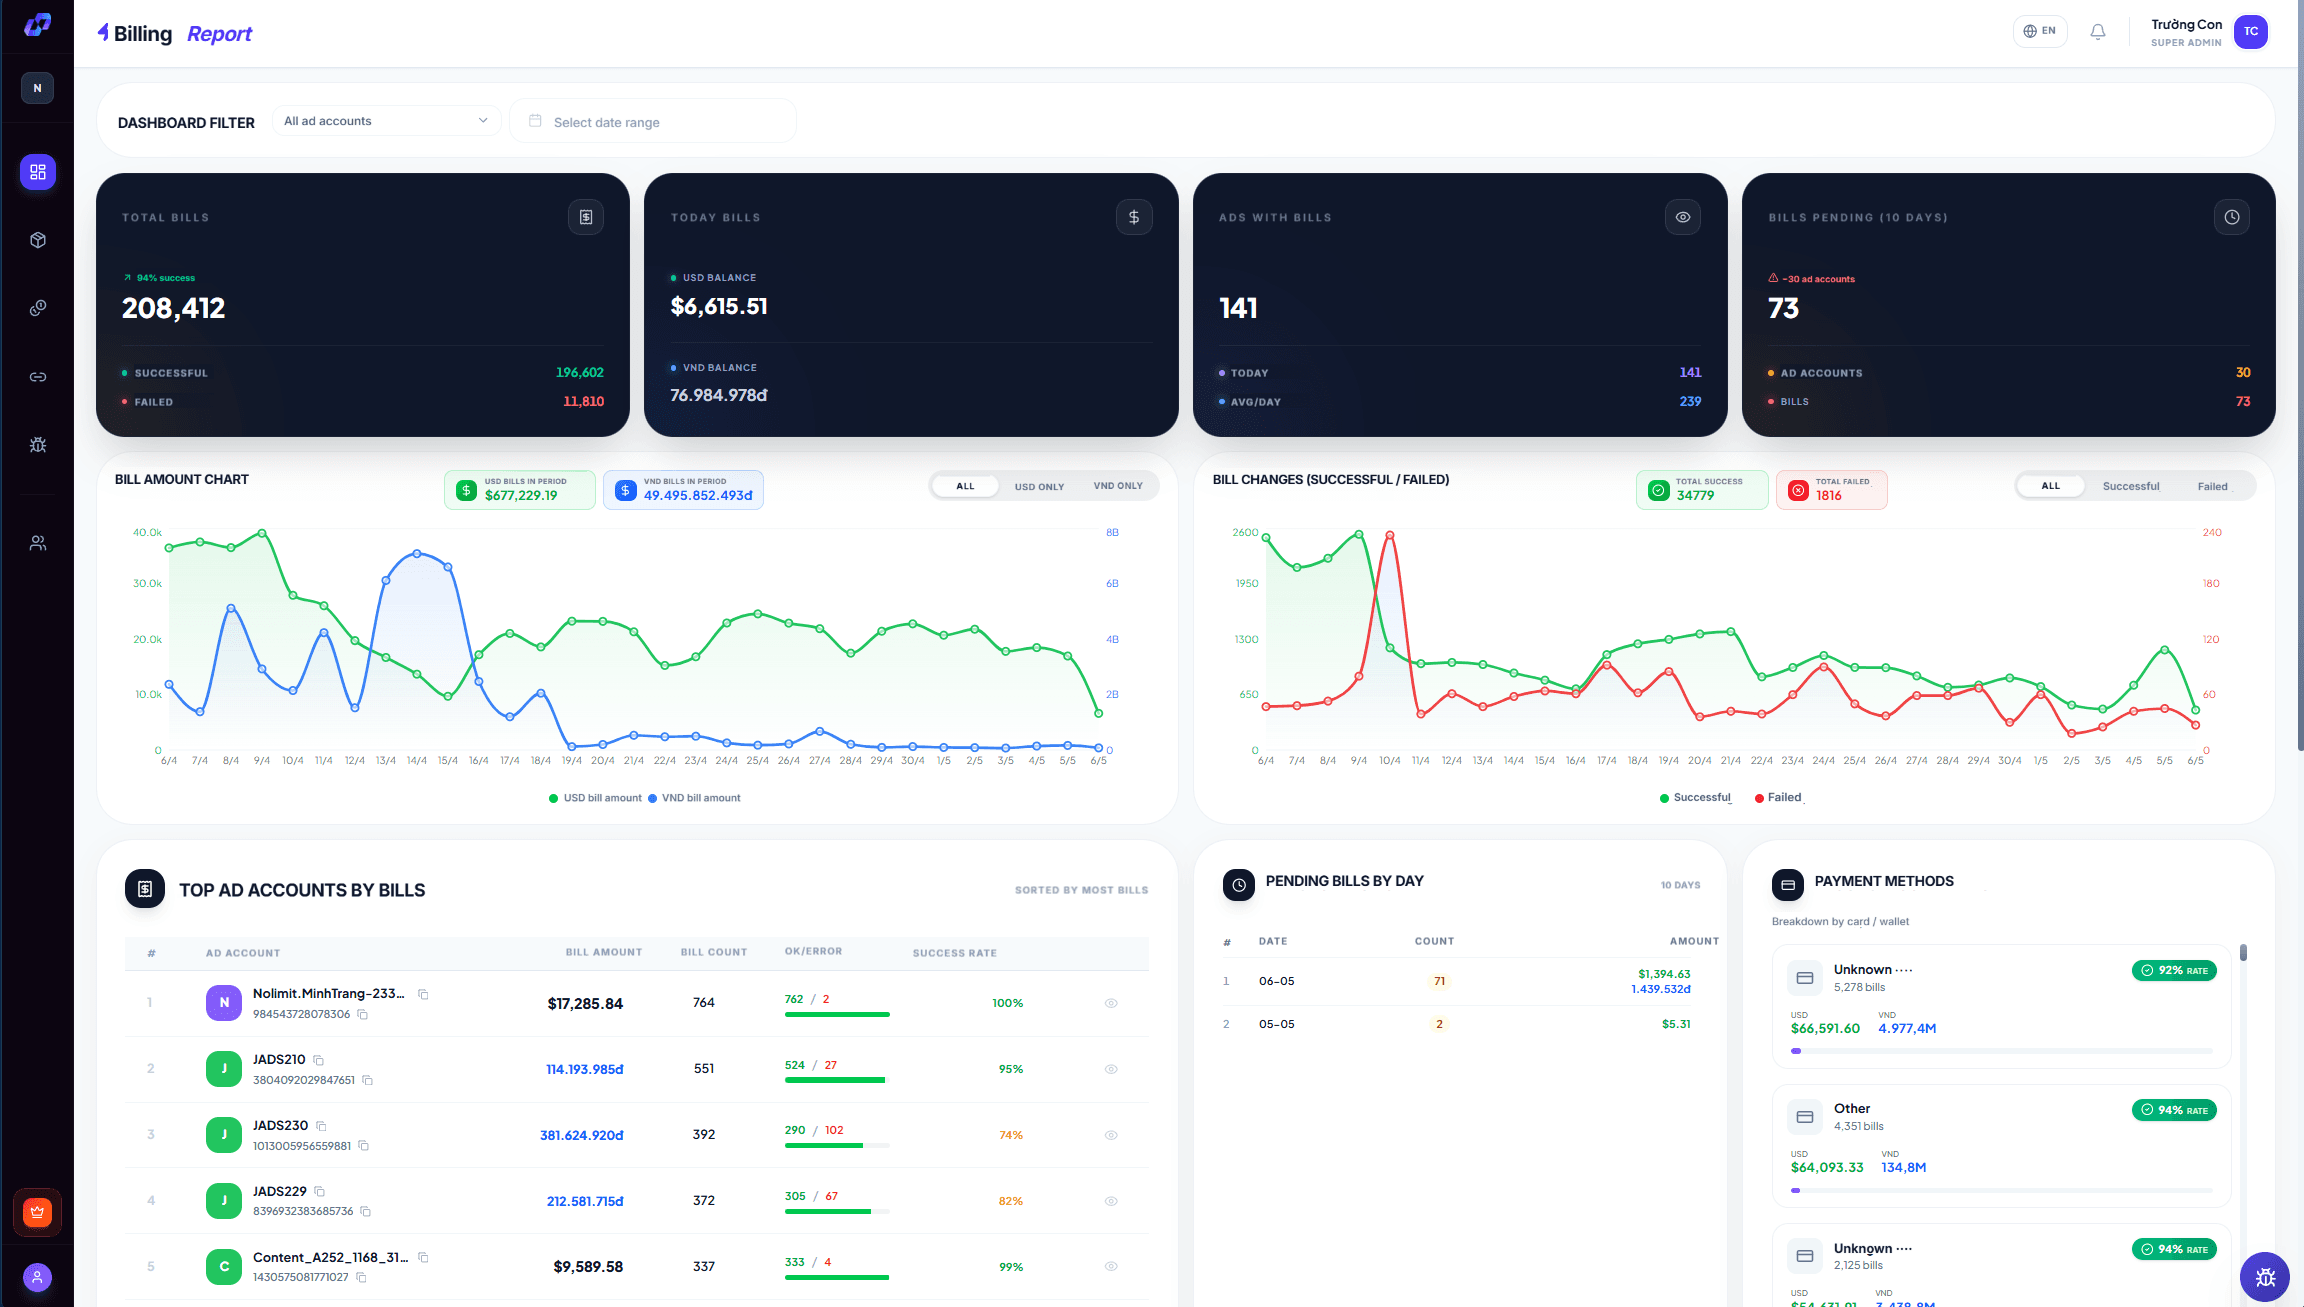
Each bill record contains:
- Facebook invoice number, ad account, bill date.
- Original amount and the workspace-currency conversion.
- Payment method (which card, which balance was used).
- Status: Paid / Pending / Failed.
3. Spend history
The Spend page logs hourly entries:
- Filter by BM, ad account, owner and date range.
- Time-zone unification — every value normalized to the workspace time zone.
- Anomaly markers (e.g. spend up > 200% versus last 7 days).
- Export to CSV / Excel for finance or clients.
4. Automatic reconciliation
The platform automatically matches Facebook spend against actual bills. The Reconciliation page shows:
- Workspace match-rate.
- Drift list — bills without matching spend (or vice versa).
- Suggested causes: FX, time-zone offset, refunds, or fraud.
💡 At month-end, a single reconciliation report is enough to send to a client — no per-BM Excel comparing required.
5. Budgets & spend alerts
Set a budget per BM, ad account, or tag group — the system warns when:
- Spend hits 80% / 95% / 100% of budget.
- Today's spend exceeds the 7-day average by more than X%.
- An ad account crosses its auto-spend limit.
6. Client-ready reports
The Finance reports page builds white-label reports containing:
- Total spend for the period + comparison vs previous.
- Breakdown by campaign / BM / ad account.
- Actual bills + match rate against declared spend.
- Your agency logo and branding — PDF export, no exposed internal UI.
Ready to bring your ad operations onto a single platform?